Locked Out 2024: Four Million Denied Voting Rights Due to a Felony Conviction
Four million Americans will be unable to vote in the upcoming 2024 election due to felony disenfranchisement laws.
Related to: Voting Rights

Overview
Laws in 48 U.S. states ban people with felony convictions from voting. In 2024, an estimated 4 million Americans, representing 1.7% of the voting-age population, will be ineligible to vote due to these laws, many of which date back to the post-Reconstruction era. In this historic election year, questions persist about the stability of democratic institutions, election fairness, and voter suppression in marginalized communities. The systematic exclusion of millions with felony convictions should be front and center in these debates.
This report updates and expands upon a quarter century of work chronicling the scope and distribution of felony disenfranchisement in the United States.1 As in 2022, we present national and state estimates of the number and percentage of people disenfranchised due to felony convictions, as well as the number and percentage of the Black and Latino populations impacted. This year, we also present state-level data on the degree of disenfranchisement among men and women. Although these and other estimates must be interpreted with caution, the numbers presented here represent our best assessment of the state of U.S. felony disenfranchisement as of the November 2024 election.
Among the report’s key findings:
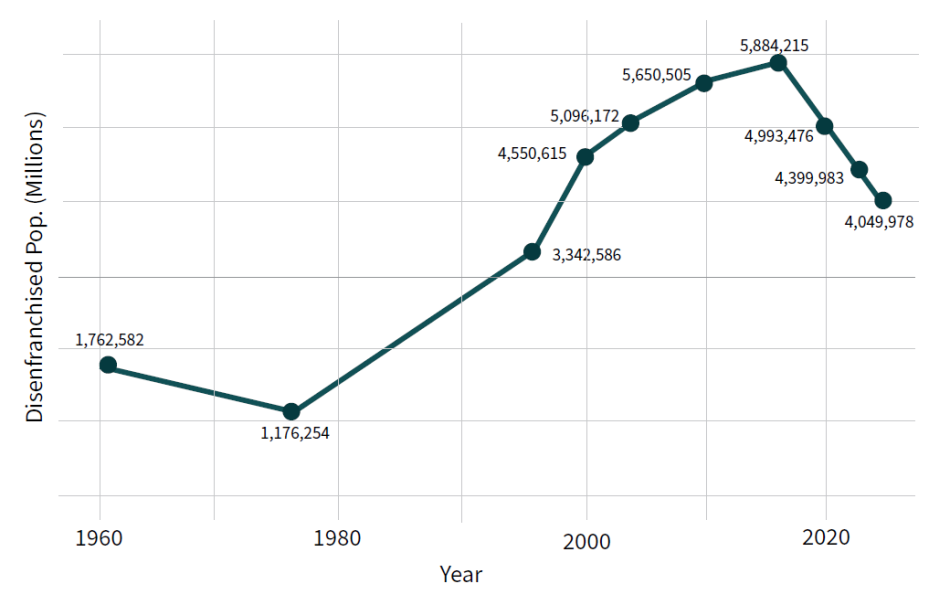
- An estimated 4 million people are disenfranchised due to a felony conviction, a figure that has declined by 31% since 2016, as more states enacted policies to curtail this practice and state prison, probation, and parole populations declined. Previous research finds there were an estimated 1.2 million people disenfranchised in 1976, 3.3 million in 1996, 4.6 million in 2000, 5.1 million in 2004, 5.7 million in 2010, 5.9 million in 2016, 4.9 million in 2020, and 4.4 million in 2022.2
- One out of 59 adult citizens – 1.7% of the total U.S. voting eligible population – is disenfranchised due to a current or previous felony conviction.
- Seven out of 10 people disenfranchised are living in their communities, having fully completed their sentences or remaining supervised while on felony probation or parole.
- In two states – Florida and Tennessee – more than 6% of the adult population, one of every 17 adults, is disenfranchised.
- Florida remains the nation’s disenfranchisement leader in absolute numbers, with over 961,000 people currently banned from voting, often because they cannot afford to pay court-ordered monetary sanctions. An estimated 730,000 Floridians who have completed their sentences remain disenfranchised, despite a 2018 ballot referendum that promised to restore their voting rights.
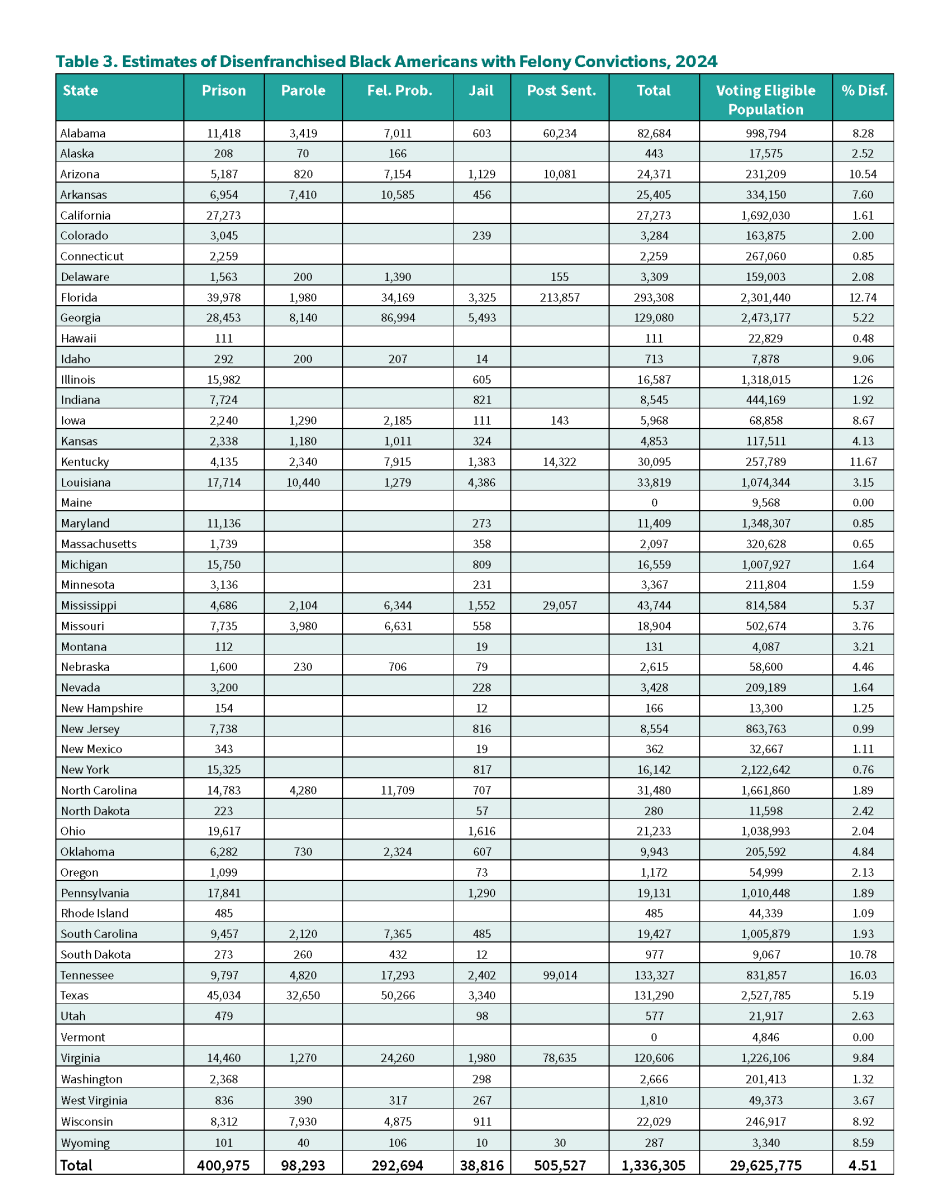
- One in 22 African Americans of voting age is disenfranchised, a rate more than triple that of non-African Americans. Among the adult African American population, 4.5% is disenfranchised compared to 1.3% of the adult non-African American population. In 15 states, 5% or more of the African American adult population is banned from voting due to a felony conviction.
- More than one in 10 African American adults is disenfranchised in five states – Arizona, Florida, Kentucky, South Dakota, and Tennessee.
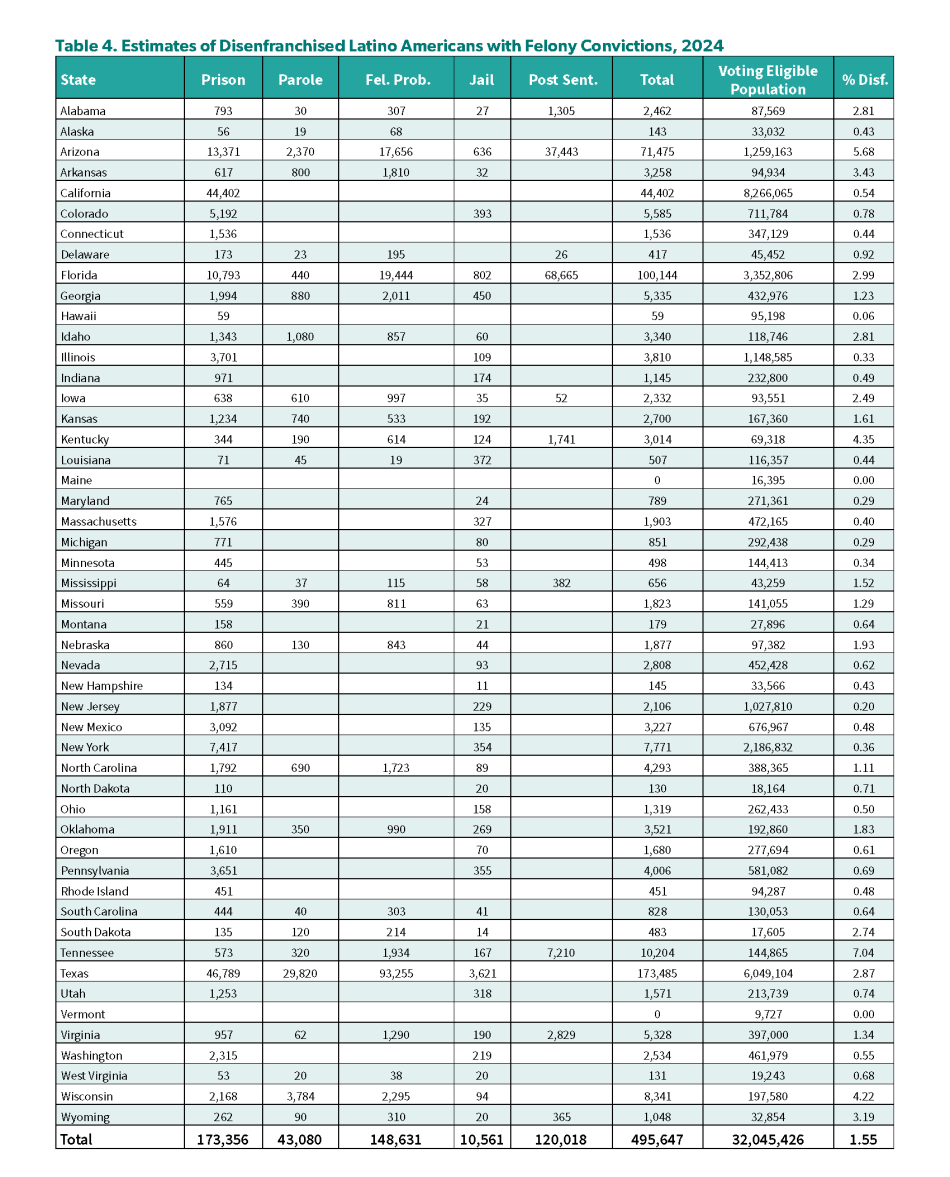
- Although data on ethnicity in correctional populations are unevenly reported and undercounted in some states, a conservative estimate is that at least 495,000 Latino Americans or 1.5% of the voting eligible population are disenfranchised.
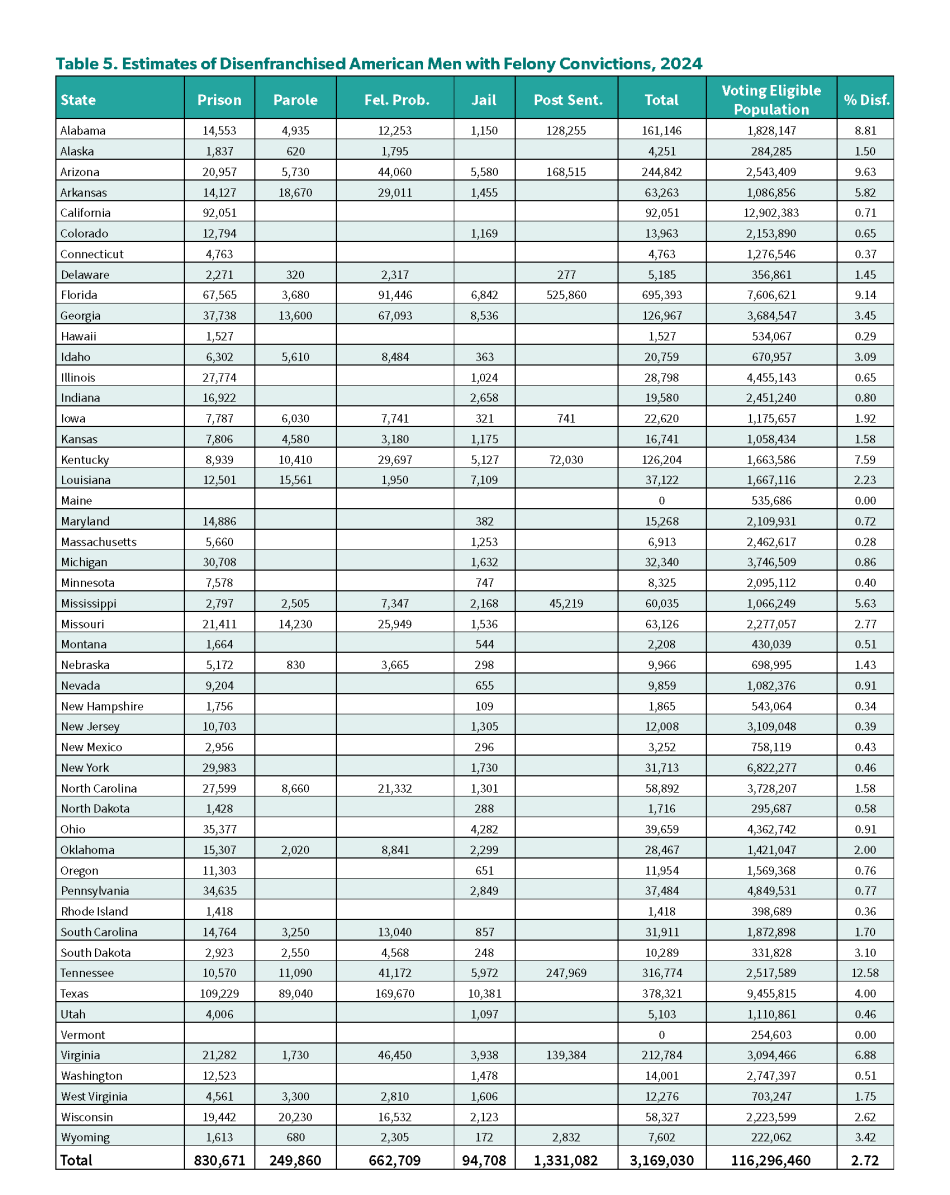
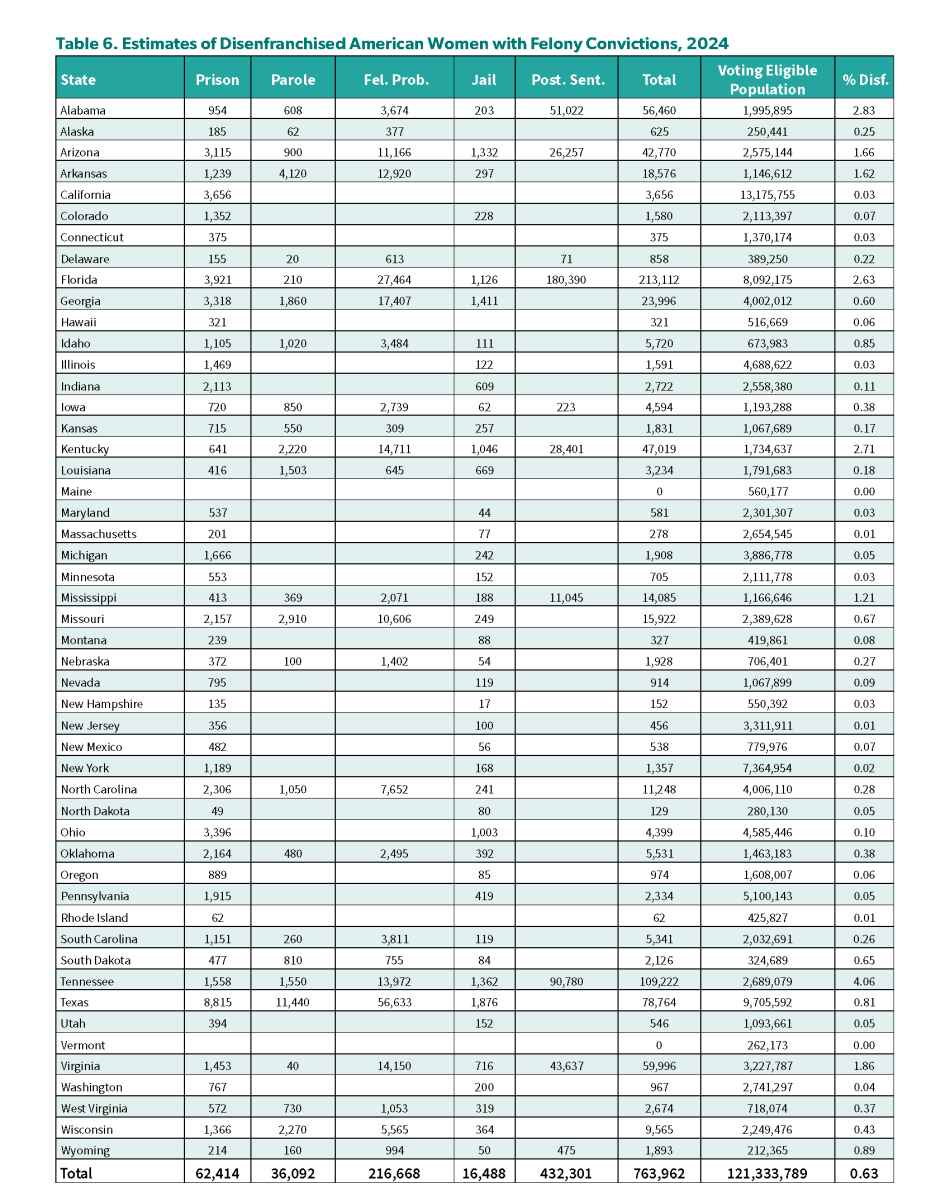
- Based on available correctional data that records an individual’s sex, approximately 764,000 women are disenfranchised, comprising about 0.6% of the female voting eligible population and approximately one-fifth of the total disenfranchised population.3 We estimate that approximately 3.2 million men or 2.7% of the male voting eligible population is disenfranchised, consistent with the overrepresentation of men in the criminal legal system.
State Disenfranchisement Reforms
To compile estimates of disenfranchised populations, we take into account new U.S. Census data on voting eligible populations4 and recent changes in state-level disenfranchisement laws and policies, including those reported by the National Council of State Legislatures (2024) and Expanding the Vote (Porter and McLeod 2023) as well as our independent analysis with legal expertise from the King & Spalding law firm.
Since January 1, 2020, laws or policy changes have taken effect in 11 states, expanding voting rights to some non-incarcerated people with felony convictions: California (parole), Connecticut (parole), Iowa (post-sentence, with exception for homicide), Minnesota (probation and parole), Nebraska (elimination of a 2-year post-sentence waiting period5), New Jersey (probation and parole), New Mexico (probation and parole), New York (parole), North Carolina (probation and parole6), Virginia (post-prison), and Washington (post-prison). Many other states implemented such changes prior to 2020 (Uggen et al. 2024) and/or streamlined the process for regaining civil rights after felony convictions.
In November 2018, Florida voters passed Amendment 4 to the Constitution of Florida by ballot initiative, which allowed most people who have completed their sentences to vote (with the exception of people convicted of sex-related offenses and murder). In 2019, however, the Florida legislature passed and the Governor signed Senate Bill 7066, restricting the voting rights of people who had not paid court-ordered monetary sanctions, and effectively “re-disenfranchised” the majority of those whose rights were restored by Amendment 4.
As shown in Table 1, Maine and Vermont remain the only states that do not restrict voting based on criminal convictions (as well as the District of Columbia and the Commonwealth of Puerto Rico). Twenty-five U.S. states, half the states in the nation, continue to deny voting rights to people on felony-level probation or parole. In the most extreme cases, 10 states continue to deny voting rights to some or all of the individuals who have successfully fulfilled their prison, parole, or probation sentences.
Table 1. State Felony Disenfranchisement Restrictions in 2024
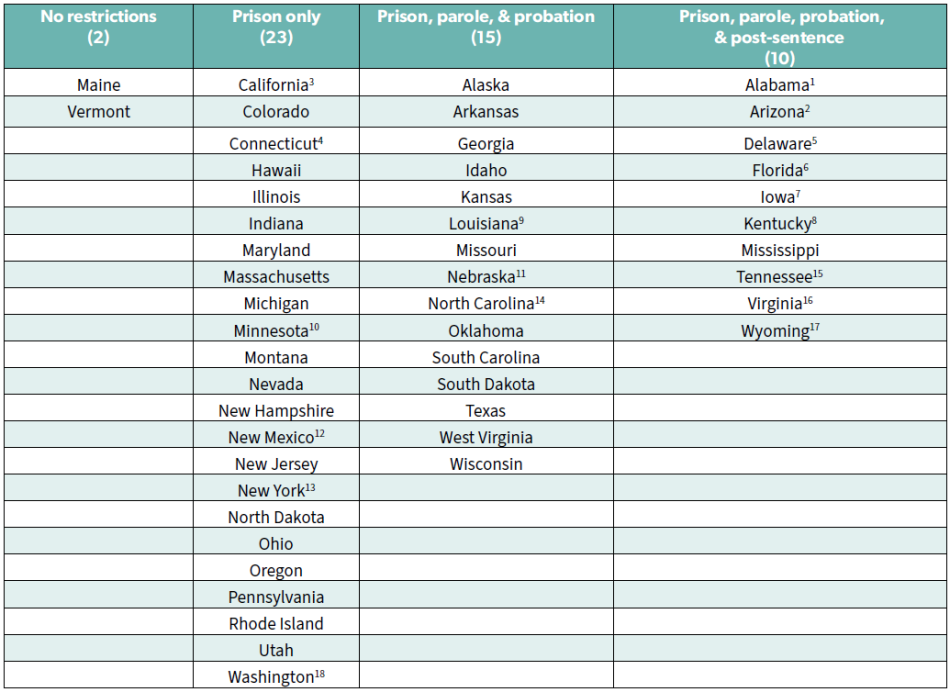
Notes regarding recent changes and state-specific post sentence disenfranchisement rules:
- Alabama – In 2016, legislation eased the rights restoration process after completion of sentence for persons not convicted of a crime of “moral turpitude.” The state codified the list of felony convictions that require restoration and those ineligible for restoration in 2017.
- Arizona – Permanently disenfranchises persons with two or more felony convictions. In 2019, the state removed the requirement to pay outstanding fines before rights are automatically restored for first time felony offenses only.
- California – In 2020, California Proposition 17 was approved and restored voting rights to people on parole.
- Connecticut – In 2021, Gov. Ned Lamont signed legislation restoring voting rights to people on parole. Connecticut does disenfranchise parolees and felony probationers convicted of election-related offenses.
- Delaware – In 2013, removed the five-year waiting period to regain voting eligibility. Apart from some disqualifying offenses, people convicted of felonies are now eligible to vote upon completion of sentence and supervision.
- Florida – In 2018, voters passed Amendment 4 to restore voting rights to most people after sentence completion. In 2019, legislation passed that made restoration conditional on payment of all restitution, fees, and fines. In 2020, the 11th Circuit Court of Appeals upheld the law requiring payment.
- Iowa – In 2020, Governor Reynolds signed an executive order restoring voting rights to people who have completed their sentences, except for those convicted of a crime in Iowa Code Chapter 707 (Homicide and Related). This follows previous executive orders from Governor Vilsack (restoring voting rights to individuals who had completed their sentences in 2005) and Governor Branstad (reversing this executive order in 2011).
- Kentucky – In 2019, Governor A. Beshear issued an executive order restoring voting rights to those who had completed sentences for nonviolent offenses. This follows a similar 2015 executive order by Governor S. Beshear, which had been rescinded by Governor Bevin later that year.
- Louisiana – In 2019, House Bill 265 went into effect, restoring voting rights for residents serving probation or parole sentences who have not been incarcerated within the past five years. Some sources count Louisiana among the states that have fully re-enfranchised people on probation (see, e.g., https://www.voiceoftheexperienced.org/voting-rights, although most interpret Louisiana’s law as continuing to restrict the voting rights of a small percentage of Louisiana’s current probation population).
- Minnesota – In 2023, Governor Walz signed legislation restoring voting rights automatically upon release from prison.
- Nebraska – In 2024, Nebraska enacted LB 20 which restores voting rights upon the completion of a sentence, including any parole term, eliminating that state’s 2-year waiting period. The law’s status is in question, however, due to a July 2024 opinion from the state attorney general Mike Hilgers that the legislature lacked authority to make this change, arguing that only the state Board of Pardons could restore voting rights after a felony conviction. On August 28, 2024, the Nebraska Supreme Court heard oral arguments in a case challenging the restoration of voting rights. As of this writing, the Court had not yet issued an opinion.
- New Mexico – In 2023, Governor Grisham signed legislation restoring voting rights automatically upon release from prison.
- New York – In 2021, Governor Cuomo signed legislation restoring voting rights automatically upon release from prison.
- North Carolina – In 2022, a North Carolina state court upheld the ruling of a three-judge panel that had restored the vote to people on probation and parole in 2021. In April 2023, the North Carolina Supreme Court overturned the trial court decision, again disenfranchising people on community supervision in that state.
- Tennessee – Disenfranchises those convicted of certain felonies since 1981, in addition to those convicted of select crimes prior to 1973. Others must apply to the Board of Probation and Parole for restoration.
- Virginia – In 2020, an Executive Order automatically restored voting rights for many people upon release from prison and provided an application process for restoration as long as not incarcerated for a felony conviction.
- Washington – In 2021, Governor Inslee signed legislation restoring voting rights to people convicted of felonies automatically after release from prison.
- Wyoming – In 2017, restored voting rights after five years to people who complete sentences for first-time, non-violent felony convictions.
Despite no longer being incarcerated, I am still considered 'less than' a citizen because the state of Texas will not allow me to vote for another 26 years while I remain on parole. If I live to see that day, I will be 81 years old when I can cast my ballot. This is an injustice to my dignity and humanity as a human being and a citizen of the United States of America.
To this day, I carry my last voter registration card with me as a reminder of the last time I had a say in my representation and the policies that govern my life. While I am currently unable to vote in the state of Texas, I will continue to fight until every individual in Texas regains the right to vote."

Methodology
As in previous years, we estimated the number of people released from prison and those who have completed their terms of parole or probation based on demographic life tables for each state, as described in Uggen, Manza, and Thompson (2006) and Shannon et al. (2017). We modeled each state’s disenfranchisement rate in accordance with its distinctive felony voting laws and policies, as listed in Table 1. For example, some states only disenfranchise those convicted of multiple felonies, and some only disenfranchise those convicted of offenses classified as violent.
In brief, we compiled demographic life tables for the years 1948-2024 to determine the number of released individuals lost to recidivism (and therefore already included in our annual head counts) and to mortality each year. This allows us to estimate the number of individuals who have completed their sentences in a given state and year who are no longer under correctional supervision yet remain disenfranchised. Our duration-specific recidivism rate estimates are derived from large-scale national studies of recidivism for people released from prison (e.g., Antenangeli and Durose 2021 and previous USDOJ reports in this series) and people leaving probation (e.g., Markman et al. 2016). Based on these studies, our models assume that most released individuals will ultimately be re-incarcerated (89 percent) and a smaller percentage of those on probation or in jail (77 percent) will return through the criminal legal system. We also assume a substantially higher mortality rate for people convicted of felony offenses relative to the rest of the population. Both people returning to the system and deaths are removed from the post-sentence pool to avoid overestimating the number of individuals in the population who have completed their sentences. Each release cohort is thus reduced each successive year – at a level commensurate with the age-adjusted hazard rate for mortality and duration-adjusted hazard rate for recidivism – and added to each new cohort of releases. Overall, we produced more than 200 spreadsheets covering 76 years of data. These provide the figures needed to compile disenfranchisement rate estimates that are keyed to the appropriate correctional populations for each state and year (see Appendix 1).
We made several important refinements and extensions of our methodology for 2024. First, we benefited from the assistance of an excellent pro bono legal research team from the King & Spalding law firm who took a fresh look at the statutes, case law, and current voting requirements across the 50 states. This led us to narrow or expand our estimates of the populations and subpopulations disenfranchised in several states, particularly for states with enumerated lists of disqualifying offenses. Second, we have updated the recidivism and mortality rates we used to calculate the disenfranchisement among people no longer under supervision in our state-specific demographic life tables, as well as improved our estimation of the convicted, felony-level current jail populations in each state. For more detail on our full estimation methodology, see Appendix 1.
Every person – regardless of their history with the criminal legal system – deserves the right to vote. That’s why it’s a right, not anything less. I was sentenced to life imprisonment as a juvenile and ultimately released in 2019. Since that time, I’ve worked tirelessly to fully restore voting rights to Georgia's formerly incarcerated population. I look forward to continuing that fight for years to come.

Disenfranchisement in 2024
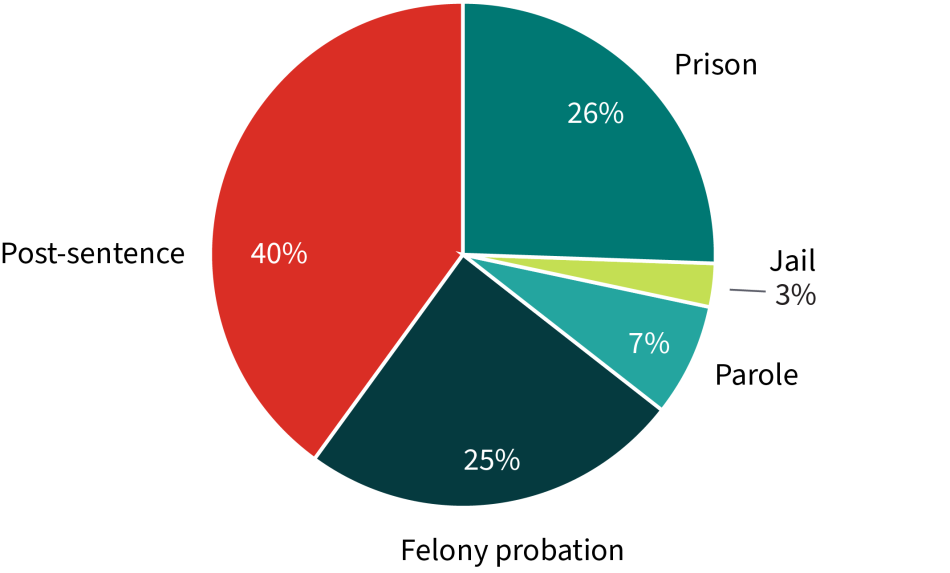
Figure 1 shows the estimated distribution of the 4.0 million disenfranchised individuals by correctional status. Approximately 72% of the disenfranchised population are living in their communities, either while supervised on felony probation or parole or after having fully completed their sentences. The largest share of the disenfranchised population (40%) has fully completed their sentence. People currently in prison and jail now represent about 29% of those disenfranchised.
Figure 1. Disenfranchisement Distribution by Correctional Status, 2024
Variations Across States
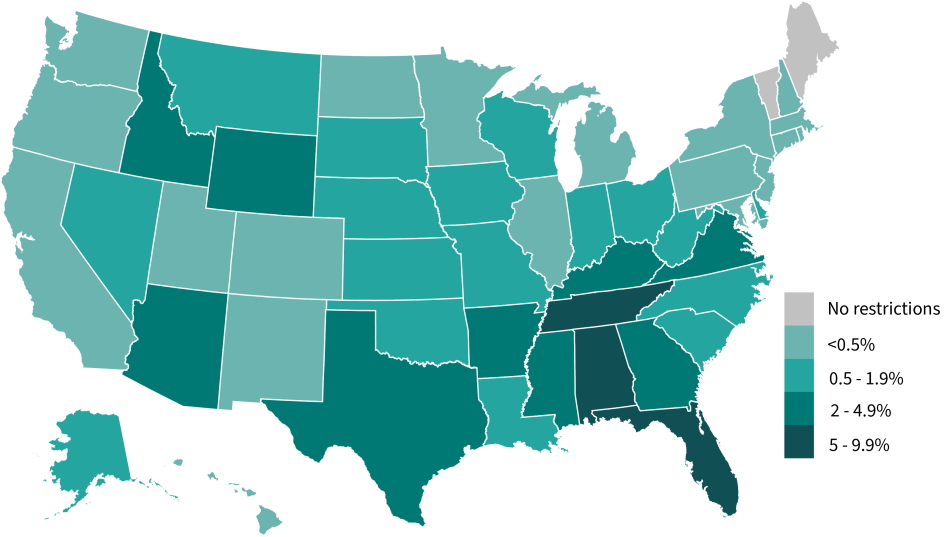
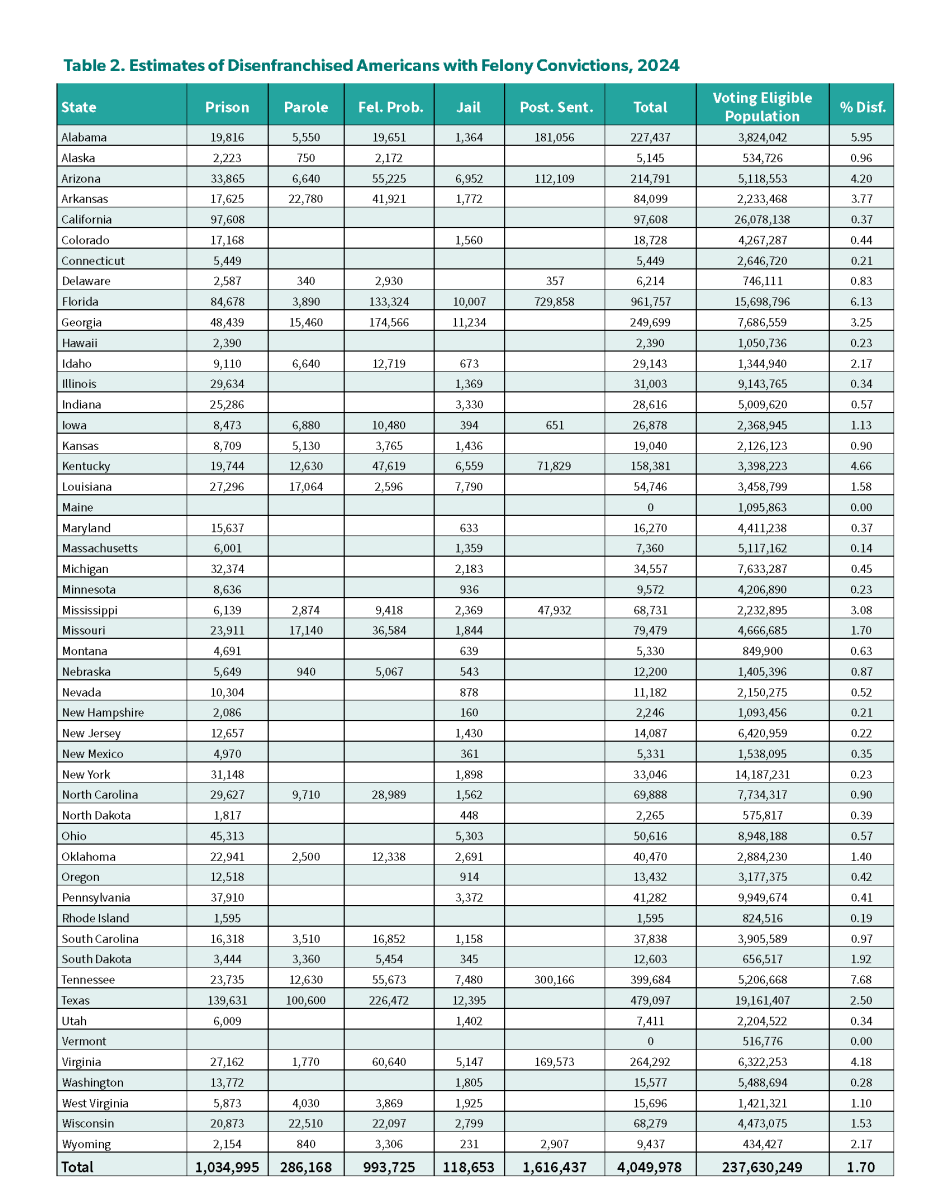
Due to differences in state laws and policies and rates of criminal punishment, states vary widely in the practice of disenfranchisement. These maps and tables represent the disenfranchised population as a percentage of the voting eligible population in each state. As noted, we estimate that the 4.0 million people currently barred from voting by state law and policy represent 1.7% of the U.S. voting eligible population. As Figure 2 and Table 2 show, state-level disenfranchisement rates vary greatly. In 2024, this rate ranged from 0.14% in Massachusetts (and zero in Maine and Vermont, which are shaded gray in the figures) to more than 7% in Tennessee and over 5% in Alabama and Florida.
Figure 2. Overall State Felony Disenfranchisement Rates, 2024
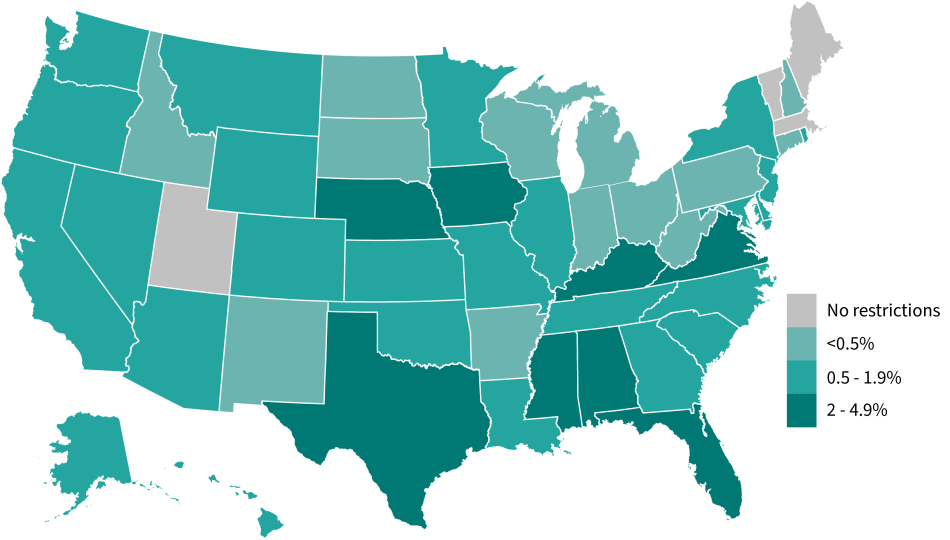
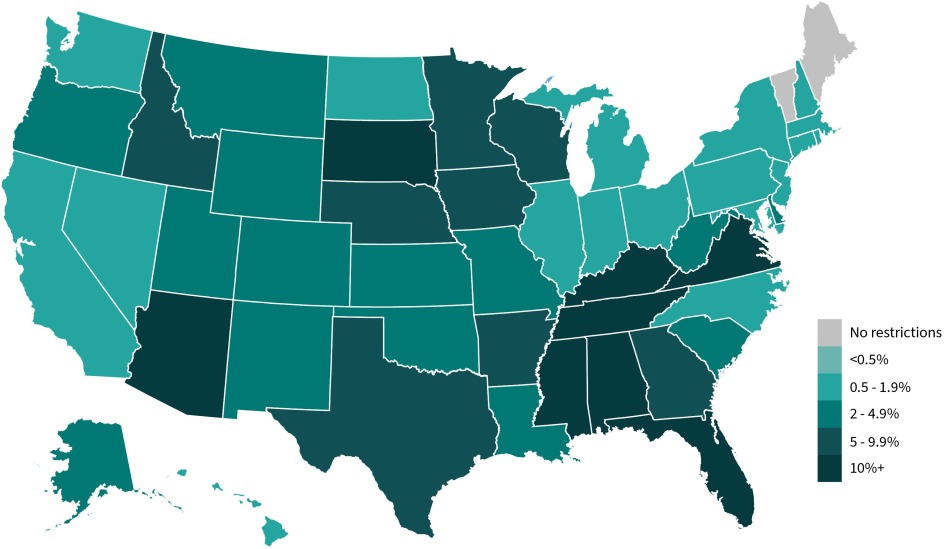
These figures reflect significant but uneven change in recent decades. Although more than half of the states have scaled back voting restrictions for people with felony convictions, several others – particularly in the Southeast – have retained such restrictions and their disenfranchised populations have increased commensurate with the expansion of the criminal legal system. Figure 3 displays disenfranchisement rates in 1980, when the national disenfranchisement rate was 1.0 percent. At that time, far more of the nation had disenfranchisement rates of approximately 0.5 percent. Alabama had the nation’s highest rate of disenfranchisement at just under 5 percent, but no state disenfranchised more than 5% of its adult citizens.
Figure 3. Overall State Felony Disenfranchisement Rates, 1980
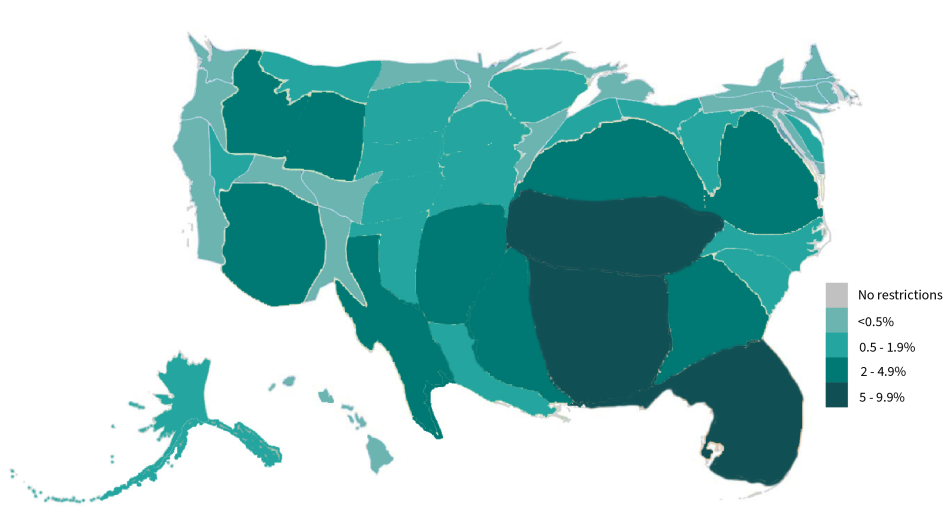
The cartogram in Figure 4 provides another way to visualize the impact of these policies by highlighting the large regional differences in felony disenfranchisement laws and policies. Cartograms distort the land area on the map under an alternative statistic, in this case the total felony disenfranchisement rate. Tennessee, Florida, and several other southern states appear bloated because they disenfranchise hundreds of thousands of people who have completed their sentences. In contrast, many Northeastern and Midwestern states shrink because they limit disenfranchisement to individuals currently in prison, or are removed from the map entirely because people in prison and other correctional populations retain voting rights (Maine and Vermont). This distorted map thus provides a clear visual representation of the great range of differences and regional variation in the scope and impact of felony disenfranchisement across the 50 states.
Figure 4. Cartogram of Overall State Disenfranchisement Rules, 2024
Trends Over Time
Figure 5 illustrates the historical trend in U.S. disenfranchisement resulting from a felony conviction, showing growth in the disenfranchised population for selected years from 1960 to 2024. The number disenfranchised dropped from approximately 1.8 million to 1.2 million between 1960 and 1976, as states expanded voting rights in the civil rights era. Many states have pared back their disenfranchisement provisions since the 1970s (see Behrens, Uggen, and Manza 2003; Uggen et al. 2024), a trend that has accelerated in the past 5 years. But because of the dramatic expansion of incarceration and community supervision, the total disenfranchised population increased to 3.3 million in 1996, and grew further to 4.6 million in 2000, to 5.1 million in 2004, to 5.7 million in 2010, and 5.9 million in 2016. Today, we estimate that 4.0 million Americans are disenfranchised by virtue of a felony conviction – a number that now falls below the number of voters disenfranchised in 2000 – a closely contested presidential election that drew national attention to the disenfranchisement of people with felony-level criminal records in Florida and across the country (Uggen and Manza 2002; but see Burch 2012; Klumpp et al. 2019). This represents a 31% drop between 2016 and 2024. Part of this observed decline is likely due to changes in our estimation methodology (as described in the appendix), but the major portion of it is due to legal changes that restored voting rights to impacted populations and recent reductions in incarceration and community supervision.
Figure 5. Number Disenfranchised for Selected Years, 1960-2024
Variations by Race and Ethnicity
Rates of punishment are highly unequal across racial and ethnic groups, such that felony disenfranchisement provisions have an outsized impact on communities of color. We first show a map of the African American disenfranchisement rate for 1980, and then show how the picture looks today. By 1980, the African American disenfranchisement rate already exceeded 10% of the adult population in states such as Arizona and Iowa, as shown in Figure 6. The figure also indicates that several Southeastern states disenfranchised more than 5% of their adult African American populations at that time.
Figure 6. African American Felony Disenfranchisement Rates, 1980
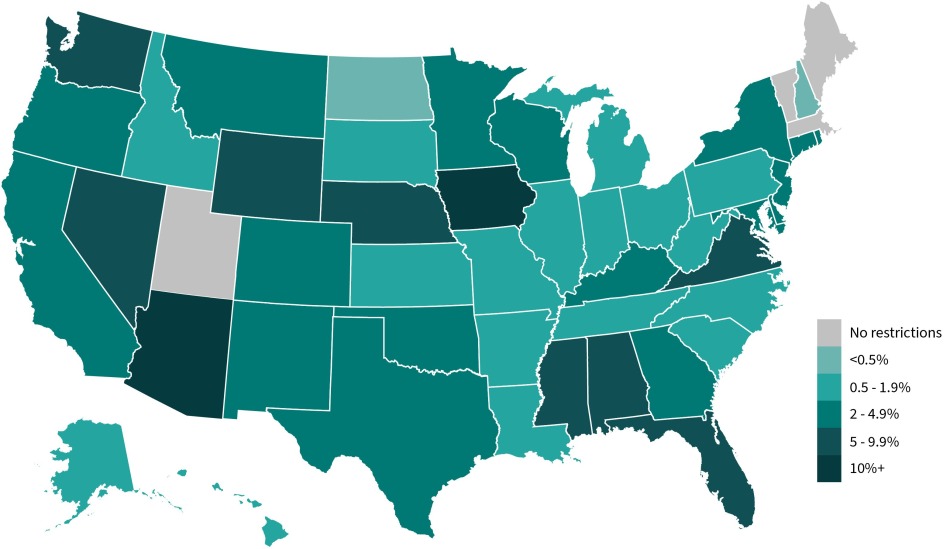
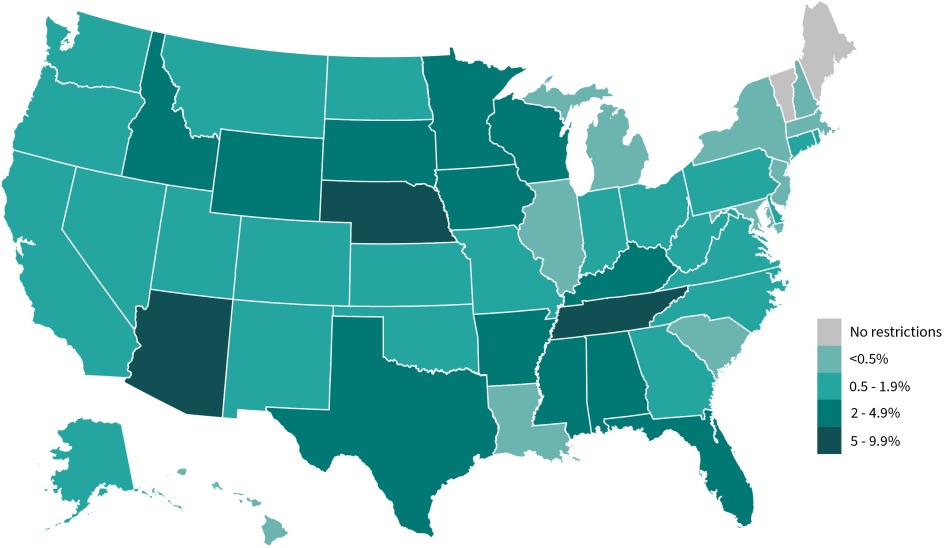
Figure 7 shows the corresponding rates for 2024, again retaining a common scale and shading to keep the map consistent with the 1980 map (Figure 6). The African American disenfranchisement rates in Tennessee now exceed 15% of the adult voting eligible population, and exceed 10% in Arizona, Florida, Kentucky, and South Dakota. Whereas 9 states disenfranchised at least 5% of their African American adult citizens in 1980, 15 states do so today.
Figure 7. African American Felony Disenfranchisement Rates, 2024
Data are limited regarding ethnicity, but more states are now consistently reporting Latino or Hispanic ethnicity for justice-involved populations. As of 2023, the U.S. Census Bureau estimates that Hispanics of any race made up almost one-fifth (19.5%) of the U.S. population, up from 6.5% in 1980 (U.S. Census Bureau 2024). We therefore compiled estimates for these populations but present them with the caveat that these figures likely undercount the true rate of Latino disenfranchisement in many states. Although data on ethnicity in correctional populations are still unevenly reported, we can conservatively estimate that over 495,000 Latino Americans (1.55% of the voting eligible population) are disenfranchised. In Arizona and Tennessee over 5% of Latino voters are disenfranchised due to felony-level convictions. Even with the likely undercounting, we observe a higher rate of disenfranchisement in the Latino population than in the general population in 28 states. Many of those disenfranchised today were convicted at a time when the Latino population was significantly smaller than it is today. Because the overall U.S. Latino population has more than quadrupled since 1980, we anticipate that Latino disenfranchisement will comprise an increasing share of those disenfranchised due to felony convictions in coming years.
Figure 8. Latino Felony Disenfranchisement Rates (Available Data), 2024
Sex and Disenfranchisement
To estimate the percentage of disenfranchised female voters, we compiled sex-specific information on prison, parole, and felony probation populations and compiled state- and sex-specific life tables to obtain the post-sentence sex distribution. By this method, we estimate that approximately 764,000 women are disenfranchised in 2024, making up just under one-fifth of the total disenfranchised population. This represents about 0.63% of the female voting eligible population (or one in 159). Figure 9 and Table 6 depict female disenfranchisement rates, again showing great geographic variation across the states. In 8 states, the female felony disenfranchisement rate now exceeds 1% of the voting eligible female population: Alabama, Arizona, Arkansas, Florida, Kentucky, Mississippi, Tennessee, and Virginia. Seven of these states impose some form of post-sentence restrictions on voting (with Arkansas being the lone exception).
Figure 9. Female Disenfranchisement Rates, 2024
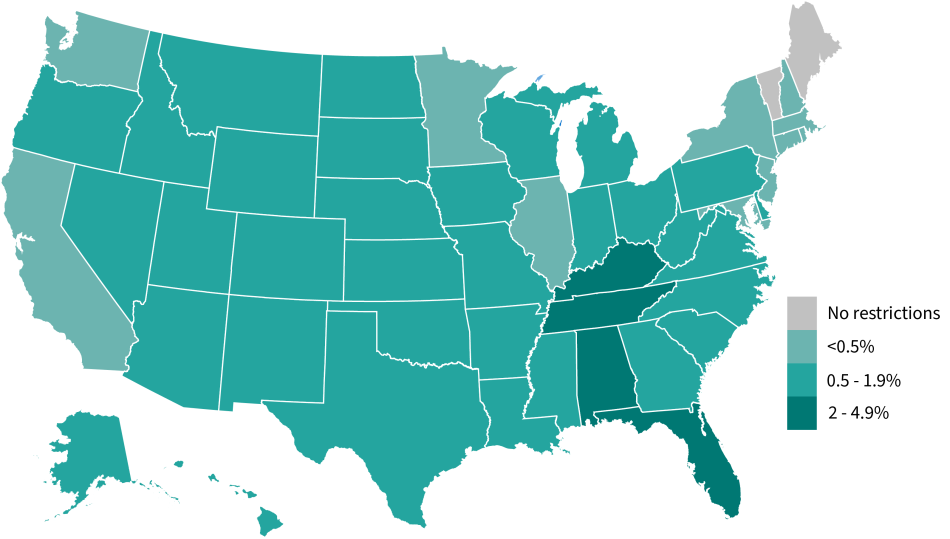
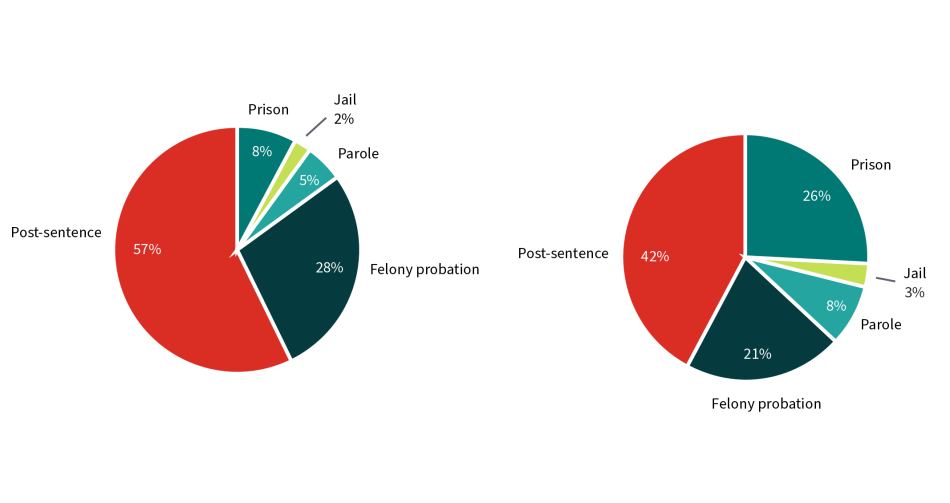
Figure 10 shows sex differences in the distribution of disenfranchisement across correctional populations. About 90% of these 764,000 disenfranchised women are now living in the community and about 10% are incarcerated in prison or jail. In contrast, about 71% of the 3.2 million disenfranchised men are living in the community and about 29% are currently incarcerated. A significantly larger share of the female disenfranchised population has either completed their entire sentences (57% versus 42% for males) or is serving time on probation (28% versus 21% for males). These differences reflect the greater representation of males in prison and parole populations, as well as the longer life expectancy and lower recidivism rates of women in the post-sentence population.
Figure 10. Female and Male Disenfranchised Populations by Correctional Status, 2024
The first time I had a conversation about the importance of voting for justice-impacted individuals was when I was incarcerated myself. Since then, I’ve dedicated my life to ensuring that every individual can cast their ballot. In Colorado, we successfully passed a law requiring county jails and detention centers to create polling locations in jails across the state. We’re going to keep up this fight until every person has the right to vote.

Recent Changes
The total disenfranchisement rate in 2024 (1.70 percent) shows a decline relative to the comparable figures for 2022 (1.89 percent) and 2016 (2.38 percent), due largely to changes in disenfranchisement laws and policies, modest downsizing of the correctional population, and, to a lesser extent, the disruptions of the Covid-19 pandemic. Some portion of these differences is also due to changes in methodology and measurement – particularly updated information about recidivism rates and jail populations. We have updated our methodology to include more refined estimates of the ineligible populations in Alabama and Mississippi, which now exclude people convicted of felonies that do not specifically appear on the state lists of disenfranchising offenses.7 Our estimates for African American disenfranchisement in 2024 are also lower than for previous years: 4.5 percent, relative to 4.9% in 2022, 5.9% in 2020, 7.1% in 2016, 7.4% in 2010, and 7.9% in 2004. Though lower than in previous years, the 4.5% rate of disenfranchisement for African Americans is more than 3 times the non-African American rate of 1.3 percent.
Florida deserves special mention, in light of the size of its disenfranchised population and the scope of recent legal and policy changes in that state. In 2018, Florida voters approved Amendment 4, which restored voting rights to people who had completed their sentences. The following year, however, Senate Bill 7066 was signed into law, conditioning restoration of voting rights on payment of outstanding monetary sanctions. Firm estimates are therefore more difficult to produce for Florida than for other states, but we have taken steps to validate our estimates of the proportion that remain ineligible in 2024. Based on our assumptions regarding the share of post-sentence residents with outstanding legal financial obligations (fines, fees, and restitution), we estimate that over 729,800 people who have completed their sentence remain disenfranchised in that state.8
As detailed in the notes to Table 1 and Appendix 1, there have been significant changes in state disenfranchisement laws and policies since our last report in 2022. Since that report, law and policy changes have been implemented in at least three states, restoring the vote to people currently on probation and parole in Minnesota and New Mexico in 2023 and eliminating the two-year post-sentence waiting period in Nebraska in 2024. As noted, the latter law’s status is in question, with the Nebraska Supreme Court having heard oral arguments on August 28, 2024. As of this writing, the Court had not yet issued an opinion. We therefore do not count those within Nebraska’s two-year waiting period among the disenfranchised in our tables or figures but note that our 2022 report estimated a total of 7,072 individuals in this category at that time.
Restoration of Voting Rights Since 2022 Report
Apart from legal changes that have re-enfranchised people whose convictions or supervision status meet certain criteria, states also provide some mechanism for disenfranchised persons to restore their right to vote. In some states, the restoration window is open to a broad share of the impacted population, but in others this window is almost entirely closed. Because state restoration procedures vary so greatly in scope, eligibility requirements, and reporting practices, it is difficult to obtain consistent information about the total rate and number of disenfranchised Americans whose rights have been restored through these generally administrative procedures. Nevertheless, as we have done in previous reports, we contacted each of the appropriate state agencies by email and phone and compiled the information they made available to us. We then subtracted all known restorations of civil rights (including full pardons) from each state’s total disenfranchised post-sentence figure in each of the 10 states that disenfranchise beyond sentence completion. In most states, those whose rights are restored by these processes represent a relatively small fraction of the total disenfranchised population in most, but not all, states (for previous years, see Uggen, Larson, and Shannon 2016; Uggen, Larson, Shannon, and Pulido-Nava 2020; Uggen, Larson, Shannon, and Stewart 2022).9
Outstanding Monetary Sanctions
In addition to Florida, other states partly condition re-enfranchisement on payment of outstanding fines, fees, court costs, and restitution. Margaret Love and David Schlussel (2020) note that Arkansas, Connecticut, Kansas, South Dakota, and Texas appear to disenfranchise some people post-sentence on the basis of unpaid legal financial obligations.10 They also identify Georgia in this category, but the Georgia Secretary of State’s office clarified in 2020 that anyone who has completed their sentence can vote, even if they owe outstanding monetary debt (Niesse 2020). The Georgia Justice Project (2024) further notes that Georgia cancels outstanding fines upon completion of probation.11 The scope and enforcement of such restrictions varies greatly across these states, such that we cannot provide firm estimates on the number of people impacted. Nevertheless, they could serve as an additional driver of disenfranchisement, above and beyond the restrictions reported in Table 1 and the numbers reported in Tables 2-6.
Immigration Status
The figures we present include estimates of the number and percentage of people disenfranchised due to a felony conviction, although some people are also ineligible to vote for other reasons, including immigration status. We lack good data on the number of people who are ineligible to vote due to both conviction status and immigration status, but current prison populations provide a baseline to estimate the magnitude of this population. As of December 31, 2022, 46 states and the Federal Bureau of Prisons reported that 58,237 non-U.S. citizens were held in state or federal U.S. prisons (USDOJ Prisoners in 2022, 2023; Strong and Motivans 2021). This represented about 15.1% and 4.9% of the total federal and state prison populations, respectively on this date. About 41% of this number (24,078) were held in federal institutions and an additional 16,855 were in custody in four states (Texas, Florida, Arizona, and Georgia). The states in which non-U.S. citizens made up the largest share of the prison population were Massachusetts (11.9%), Nevada (8.1%), New Jersey (7.9%), and Arizona (7.2%).
Resistance to Expanding the Vote
In mid-August before the 2022 midterm election, Florida Governor Ron DeSantis (then running for re-election) announced that the newly created Office of Election Crimes and Security had arrested 20 Floridians for voting or registering to vote while ineligible due to a prior felony conviction. These arrests gained significant media attention, peaking about three weeks before the election when bodycam footage was released. This footage depicted not only the arrests of three people accused of voting illegally, it also showed how surprised, confused, and distraught they were (Izaguirre 2022). Of these arrests, Gov. DeSantis (Office of Governor 2022) remarked, “Our new election crimes office has sprung into action to hold individuals accountable for voter fraud… If you commit an elections crime, you will be prosecuted to the fullest extent of the law.” Many observers also saw these high-profile arrests as sending a message, but not about law and order. After describing the confusing process and the lack of accessible data, the Washington Post Editorial Board (2022) argued,
[T]he system remains so opaque that there’s no easy way to find out whether you owe fees or fines stemming from a past conviction. There’s no centralized tracking system for either citizens or elections officials to check. All 67 counties and various state agencies maintain their own databases. Mr. DeSantis’s broader goal is clear: to deter voting.
Neil Volz, Deputy Director of the Florida Rights Restoration Coalition, described these events as creating a chilling effect for returning citizens (Izaguirre 2022).
Florida was not alone in ramping up their scrutiny of voters, though not limiting their oversight to voters with criminal records. States like Virginia, Arkansas, Idaho, and Missouri have either taken executive action or introduced bills to create offices similar to Florida’s Office of Election Crimes and Security in recent years (Moomaw 2022; Arkansas HB 1513; Idaho HB 470; Missouri SB 724). Texas Governor Greg Abbott signed a bill in August 2024 which removed one million people from its voter rolls, including 6,000 people who have a felony conviction (Office of the Texas Governor 2024).
Some states have also pushed back against the national trend toward expanding the franchise by raising the threshold for restoration or making it more difficult for people with felony convictions to vote. In Alabama, a state that disenfranchises people convicted of crimes of “moral turpitude,” the legislature passed HB100 in 2024 which adds more than 120 new crimes to the list of disqualifying moral turpitude crimes, according to the Campaign Legal Center (Bowie, Cooper, and Boettcher 2024). Although it was originally set to go into effect on October 1, 2024, the Alabama Attorney General issued guidance that it would not be implemented until after the election following a lawsuit (Chapoco 2024).
Nebraska has also been the site of significant resistance to voting rights restoration. Prior to 2005, voting (and other civil) rights for people with felony convictions were only eligible to be restored by the Board of Pardons through the pardon process. Then in 2005, Neb. Rev. Stat. § 29-112 was amended, creating automatic voting rights restoration after a two-year waiting period following the completion of the sentence. In spring of 2024, the state legislature passed LB20, which removed the two-year waiting period (Nebraska Legislature 2024). Later that summer, however, the Nebraska Attorney General issued an opinion stating that the new reform and the underlying statutes it amends (that is, the statute that created the two-year waiting period) usurped power from the Board of Pardons and thus violated the separation of powers (Hilgers 2024). The Secretary of State, following the Attorney General’s opinion, ordered local election officials to no longer register any voters with prior felony convictions. A suit was immediately filed in state court and is under consideration by the Nebraska Supreme Court at the time of this writing.
The people who know the most about the importance of voting rights are far too often the people who have had that right stripped away. Every day, directly impacted people inspire me to continue working to ensure that every individual in Nebraska has the resources and support necessary to fully participate in the democratic process.

Summary
This report provides new state-level estimates on felony disenfranchisement for 2024 and updates those provided by Uggen, Larson, Shannon, and Stewart (2022) for previous years. In Tables 2, 3, 4, 5, and 6, we provide state-specific point estimates of the total disenfranchised population, the African American disenfranchised population, the Latino disenfranchised population, the male disenfranchised population, and the female disenfranchised population subject to the caveats described below.
Despite significant legal changes in recent years, and a general decline in state prison, probation, and parole populations in recent years, 4 million Americans are disenfranchised due to criminal convictions in 2024. This number has declined an impressive 31% since 2016, when approximately 5.9 million were disenfranchised. Levels of disenfranchisement today are now well below the 4.6 million who were denied the vote in 2000, when disenfranchisement may have played an important part in a closely contested presidential election. When we break these figures down by race and ethnicity, it is clear that disparities in the criminal legal system continue to shape disparities in political representation, as over 4.5% of the African American voting eligible population is currently disenfranchised due to a felony conviction. The distribution of disenfranchised individuals shown in Figure 1 also bears repeating: less than 29% of this population is currently incarcerated, and approximately 2.9 million adults who live in their communities are banned from voting. The significant reforms implemented in the past eight years have helped to restore the rights of over 1.8 million voters, yet 4 million remain locked out today. Although many states have incrementally expanded voting rights for non-incarcerated citizens, it is also notable that Maine, Vermont, the District of Columbia, and the Commonwealth of Puerto Rico remain the only jurisdictions that allow persons in prison to vote.
Understanding the Numbers and Assumptions
We have taken care to produce estimates of current populations and “post-sentence” populations that are reliable and valid by social science standards. Nevertheless, readers should bear in mind that our state-specific figures for the 10 states that bar individuals from voting after they have completed their sentences remain point estimates rather than actual head counts. In addition, the prison, probation, parole, and jail populations we report for 2024 are also estimated, based on year-end 2022 data. In other work, we have presented figures that adjust or “bound” these estimates by assuming different levels of recidivism, inter-state mobility, and state-specific variation. With these caveats in mind, the results reported here present our best account of the prevalence of U.S. disenfranchisement as of election day 2024. These estimates will be adjusted if and when we discover errors or omissions in the data compiled from individual states, U.S. Census and Bureau of Justice Statistics sources, or in our own spreadsheets and estimation procedures. Importantly, our figures only estimate the number of individuals legally disenfranchised based upon current state law and policies. Our figures do not include aspects of “practical” or de facto disenfranchisement — wherein individuals legally allowed to vote do not do so due to legal ambiguity, misinformation regarding voting eligibility, fear of an illegal voting conviction, among other reasons related to criminal records and voting. Further, it is an open question as to whether states that have disenfranchising offense lists extend voting access to those currently incarcerated on convictions that do not match the disenfranchising list. In other words, the estimates here do not reflect any chilling effects that disenfranchisement laws and their enforcement may have.
The right to vote is fundamental to our democracy. Everyone should have a say in the laws and regulations that govern their dignity, quality of life, and the lives of their families. It has been a true joy helping people across Alabama reclaim their political power and advocate for meaningful change. In a state with such a deep history of fighting for civil rights, ensuring that every person can participate in our democracy is a crucial step toward true justice and equality.
Appendix 1: Felony Disenfranchisement Methodology
Our estimates rely on a number of assumptions and methodologies due to complexities and ambiguities in the laws governing voting rights and the limitations of the available data on the relevant justice-impacted populations. Here we detail our team’s research approach and the methodological choices we made in addressing these limitations and complexities. With each iteration of our report, we attempt to update and improve our estimates and the methodology that underlies them. Although we recognize that some degree of error likely remains, we have done our best to avoid systematic errors and biases in compiling these figures.
Populations in the Criminal Legal System
Prison, probation, and parole populations were obtained from the National Prisoner Survey, BJS Data Tools, and supplemented with data from the BJS Prisoner and Probation and Parole reports, which contain the most recent observed correctional populations (2022). The data reported are thus based on estimates of the most recently available data, though we caution that such counts have fluctuated greatly since the Covid-19 pandemic. Probation populations were adjusted by the percentage felony probation among all probationers in 2018 (most recent observed data point available from the Annual Probation Survey), assuming that the percentage of people with felony convictions is uniform across race, ethnicity, and sex (a required assumption without cross-tabulated race and charge counts). This methodology is commensurate with previous Locked Out estimates. For states with missing data on current felony probation and parole subpopulations in a given state and year, the race and sex estimates are based on the share of the known prison population in each race or sex group.
Jail counts were sourced from the BJS’ Annual Survey of Jails (ASJ). The ASJ is a probability sample of jails within U.S. jurisdictions conducted annually. We calculate the jail populations at mid-year 2022 (most recent data in the series available) by aggregating overall, race-specific, and sex-specific design/nonresponse weighted sums within each U.S. State. We calculate each state’s percentage felony in jail by aggregating the weighted felony counts and weighted total counts and calculating the weighted proportion of percentage felony (felony weighted/total weighted). We then compile a similar aggregation to obtain the proportion convicted for each state. These two proportions are then multiplied to obtain an adjustment factor indicative of convicted felony status. This adjustment factor is then applied to the overall mid-year jail population in 2022 for each state to estimate the number of people incarcerated in jail convicted for a felony offense. The ASJ does not include a cross-tabulation of felony status and conviction status, nor does the survey have felony and convicted counts by race and gender subgroups. Previous Locked Out reports assumed a uniform 10% felony adjustment to all jail numbers, and this improved method allows each state to have its unique percentage felony and conviction percentage to adjust the jail count for each population (the 10% figure applied in previous reports represents an underestimate for most states and years, therefore we have somewhat higher jail estimates in the 2024 report than in previous years). Because race-, ethnicity-, and sex-specific felony-convicted jail counts are not available, we assume stability in the adjustment factor across demographic categories and apply this adjustment to the overall and subpopulation overall counts to estimate the jail population convicted of felonies.
For disenfranchising states with an integrated jail/prison system (Alaska, Connecticut, Delaware, Hawaii, and Rhode Island), current correctional populations are reported to the Bureau of Justice Statistics as one number and therefore not disaggregated by jail and prison populations. We adjusted the total reported prison populations in Alaska, Connecticut, Delaware, Hawaii, and Rhode Island downward by deducting the estimated percentage of people who are serving non-felony sentences or awaiting trial. To do so, we consulted annual reports from state-specific sources (e.g., Alaska Criminal Justice Commission, the Connecticut Office of Legislative Research, the Delaware Department of Correction, the Hawaii Prison Profile Dashboard, the Rhode Island Department of Corrections) and the Bureau of Justice Statistics Data Tool (“Maximum Sentence Length for Inmates” in 2021, the most recent year available). This information allows us to effectively remove the estimated number who are incarcerated but not legally disenfranchised from the total integrated system number reported to the Bureau of Justice Statistics.
Data on race and ethnicity have not been consistently collected or reported in the data sources used to compile our estimates, so our ability to construct these estimates is limited. This is especially the case for Latino populations, who now constitute a significant portion of criminal justice populations. Race data on criminal justice populations is more complete, at least for African American populations, and we used the most recent data available from the Bureau of Justice Statistics to develop the state-specific disenfranchisement estimates for the African American voting eligible population (shown in Figures 6 and 7 and Table 3). For the 2024 estimates, we used the U.S. Census Bureau’s American Community Survey data to obtain denominators for both the overall and population-specific voting eligible populations. As noted below, our estimates are based on race-specific recidivism rates (resulting in a higher rate for African Americans) that reflect current scholarship on punishment and recidivism. This results in a higher rate of attrition in our life tables, but produces a more conservative and, we believe, more accurate portrait of the number of disenfranchised African Americans.
Life Tables
We construct 100 life tables, covering 10 post-sentence disenfranchising states, 5 correction population groups, and for both post-sentence prison releases and felony probation entries (10 post-sentence states * 5 populations of interest * 2 correction populations = 100 life tables). Each life table takes historical correctional cohorts each year from 1948-2024 (assuming stability in correctional inputs from 2022 for years 2023-2024), and adjusts each cohort iteratively each year until 2024 with the following formula:
Ritcg— Citcg — Ditcg = Gitcg
where Ritcg is the number of individuals in a correctional cohort (prison releases or probation entries, described below) released or remaining from the previous year in each state (i) and year (t) from a particular correctional population (c) and subgroup (g) (overall, African American, Latino, male, female), Citcg is the number of individuals in a particular cohort estimated to have been reconvicted (and therefore appears in current population counts or enters life tables in a subsequent cohort), Ditcg is the number of individuals in the particular cohort estimated to have died, and Gitcg representing the number of individuals remaining as of 2024 in a particular post-sentence cohort. We then sum the estimated remaining as post-sentence individuals in 2024 across each release/entry cohort (t) within each particular correctional population (c), subgroup (g), and state (i) to obtain an estimate of the number of post-sentenced individuals barred from voting. We then apply to these estimations various adjustment factors as described below. More details on our life table approach are available in Shannon et al. (2017) and Uggen and Manza (2002).
Prison, Parole, Probation, and Jail Population Inputs
The correctional inputs for the overall prison life tables consist of conditional and unconditional releases from state prisons. For early years, our data sources are primarily United States Department of Justice (USDOJ) publications, including annual series such as Probation and Parole in the United States, as well as Prisoners and Jail Inmates at Midyear. We also referenced National Prisoner Statistics, and Race of Prisoners Admitted to State and Federal Institutions, 1926-1986. Contemporary conditional and unconditional prison releases were obtained from the BJS Prisoners reports. Specifically, for 2022 the numbers are located in Table 9, which details the 2021 and 2022 conditional and unconditional releases for each state. Because 2023 and 2024 data are not yet available, stability is assumed from 2022 for all life table correctional inputs.
Our life tables use probation entries instead of exits so that we can best account for recidivism and death processes in our calculations (we adjust for double counting of current populations by subtracting our current felony probationers as described below). The correctional inputs for the felony probation life tables consist of probation entries for each state (adjusted for 2018 percent felony commensurate with the current probation populations – again, the most recent available) and felony jail counts in each year obtained via Vera’s Incarceration Trends Dataset (2007-2018) and the BJS’ Annual Survey of Jails (2020-2022). 2019 is interpolated as no ASJ was fielded by the BJS in that year. All correction population inputs assume stability from 2022 to estimate 2024 correctional populations to avoid “carrying forward” any post-covid changes in punishment patterns into the future.
Jail numbers were calculated commensurate with the approach described above for the current populations (we also adjust for double counting here by subtracting out current jail populations) both for the overall estimates and each subpopulation. Previous Locked Out reports (2020; 2022) used the Vera Incarceration Trends data, which include the ASJ as its primary data source. Vera’s data only goes to 2018 (as of 6/21/2024). Therefore, we back-fill our life tables with observed data from 2020-2022 from the ASJ. The BJS did not release an ASJ in 2019, so the values for 2019 are interpolated as the midpoint between 2018 and 2020.
Conditional and unconditional releases for the African American (AA) life tables are estimated by adjusting the overall conditional and unconditional releases for each post-sentence state by the percent AA prison in each respective year for the unconditional releases and the percent AA parole (2018 – the most recent year from BJS’ Annual Parole Survey) for the conditional releases in each year. African American felony probation estimates for life table entry were obtained by adjusting the yearly overall probation entries by both the 2018 percent felony adjustment factor (the most recent year available from BJS’ Annual Probation Survey) and the percent AA probation in each respective year. For 2007-2022, the jail inputs reflect felony adjusted African American jail midyear populations as reported by the Vera Incarceration Trends Dataset (2007-2018) and BJS’ Annual Survey of Jails (2020-2022) (2019 is interpolated commensurate with above).
Correctional ethnicity data is historically sparse. Therefore, we utilize a data augmented extrapolation technique to estimate the proportion of prisoners and felony probationers that are of Hispanic ethnicity. Specifically, we use observed percent Hispanic from the BJS’ National Prisoner Statistics (1978-2022) and Annual Probation Surveys (1994-2018).12 For recent years not yet observed in each series (e.g., after 2022 for prison), we use a linear extrapolation of the percent Hispanic from the most recent two observed data points for each series. For the historical missing proportions outside of the observation windows of each respective data source, we augment Current Population Survey (CPS) data and estimate state-specific percentage Hispanic for both prison and probation populations by applying the state-specific percentage change in the overall state Hispanic population to each successive year historically to 1948. This assumes, historically, that the prison and probation populations evolved in concert with the overall Hispanic population in each state.13
Sex-specific release data from prison, both conditional and unconditional, were obtained from the National Prisoner Statistics Dataset (1978-2022). Stability in the sex-specific releases was assumed from 2022 onwards and for years prior to 1978, when more complete annual data became available. We adjust the overall conditional and unconditional releases by the percentage male and female. Sex-specific probation entry data does not currently exist from the BJS, therefore we obtained the overall number of probation entries (as discussed above) and adjusted it using the year- and state-specific percentage male and percentage female of the probation population reported in the National Probation Survey. The percentage male and percentage female probation population proportions have varying data reporting across states and therefore several assumptions were made regarding interpolations and/or stability. Each cohort’s overall probation entries are adjusted by these sex-specific proportions. The existing overall entries were already adjusted for percentage felony, and the recent entries are adjusted by the 2018 percent felony (most recently observed). Jail entry data for the sex-specific life tables were estimated commensurate with the methodology described above using the ASJ for the years 2020-2022. For 2007-2022, the jail inputs reflect felony adjusted sex-specific jail midyear populations as reported by the Vera Incarceration Trends Dataset (2007-2018) and BJS’ Annual Survey of Jails (2020-2022) (2019 is interpolated commensurate with above). Historical jail estimates start with the legacy jail overall data series and multiply by percent male and female jail from 2007 backwards.
Recidivism
For recidivism estimates from 1984-2007, we used the Bureau of Justice Statistics’ “Recidivism of Prisoners Released in 1983” figures for the first three years (used re-incarceration figures). The BJS data indicated a recidivism rate of 18.6% by year 1, 32.8% by 2nd year and 41.4% by the 3rd. To extend the analysis to additional years, we used the ratio of increases provided by Hoffman and Stone-Meierhoefer (1980) for federal prisons to estimate 6 years of data. From these data, we obtained estimates of the percent recidivating of those remaining from the previous year. We further extended the recidivism estimates by using Broadhurst and Mailer (1990) to extend the estimates to the 10th year after release. We also inserted a specific recidivism rate for the 50th year: 65%. These data were then used to estimate a logarithmic trend line for the survival rate. The equation for the line between our 10-year data point and the 50-year point is: y=-0.0304*(Ln (x)) + 0.4636. We only used the 6th through 10th year of data for this trend line estimation since this helped to slow down the survival rate’s rapid decrease. This equation enabled us to gain estimated percent recidivating each year, through 50 years. By the 10th year approximately 59.4% of the original cohort of released individuals had recidivated (or about 3.33% of those remaining after the 9th year). By 20th year: 62.7%, 30th year: 64.0%; 40th year: 64.9%; and by year 50: 65.5% of the original cohort of released individuals had recidivated (or about .178% of those remaining from the 49th year). Our Locked Out reports for 2016, 2020, and 2022 use these recidivism estimates.
For Locked Out 2024, we improved upon our legacy recidivism methodology by (a) using a newer BJS recidivism study upon which to base our estimates for the overall life tables 2008 and onwards (Antenangeli and Durose 2021) and (b) making our recidivism estimates population dependent by allowing each recidivism curve to vary by each respective population under estimation (Overall, African American, Latino, Male, Female). Legacy recidivism curves are used for years 1948-2008 in the overall life tables. The new recidivism curves are used in the cohorts from years 2008-2024 in the overall tables.
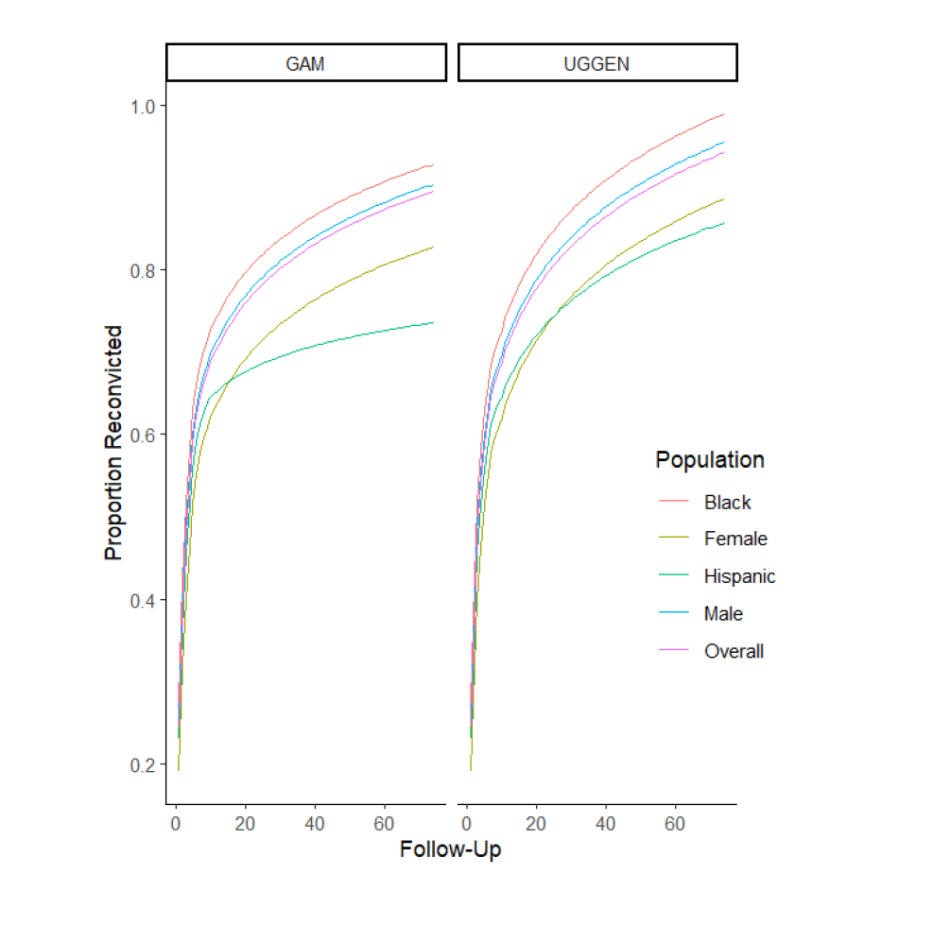
For population-specific recidivism estimates, we used the Bureau of Justice Statistics’ Recidivism of Prisoners Released in 24 States in 2008 (Antenangeli and Durose 2021) which contains a 10-year reconviction follow up for each population. We then model the cumulative failure from years 11-74, using both Uggen’s method (Uggen and Manza 2002) (the model used to create the recidivism curves in previous Locked Out iterations) and a generalized additive model (GAM) using a population-specific cubic spline. For Locked Out 2024, we use the GAM method, and predict cumulative failure for years 11-74. We choose the GAM method, as it is more sensitive to the “tapering-off” of recidivism failure in the later observed years. From these predictions, we obtained estimates of the percent recidivating of those remaining from the previous year by dividing each year’s predicted failure rate by the lagged cumulative survival, obtaining a recidivism hazard for each year (years 1-10 use the observed data points). Cumulative failure of recidivism amongst those released from prison by year 74 follow-up is estimated to be 89.5% overall, 82.8% for females, 90.4% for males, 73.6% for Latino releasees, and 92.9% for Black releasees. These population-specific recidivism hazards are used for all cohorts from 1948-2024 in the population-specific life tables.
Recidivism Cumulative Failure by Population
BJS 2008 Special Report
For probation recidivism in our updated methodology, population-specific recidivism estimates are not published by the BJS. Therefore, we used the BJS’ 2016 probation recidivism study (Markman et al. 2016) and used the state-level cumulative failures for follow ups from 1-5 years (from Figure 4 in Markman et al. 2016). These were used to create yearly recidivism hazards commensurate with the method for prison described above. These estimates were then used to create an overall ratio between the prison recidivism and observed probation recidivism (years 1-5). The year 5 ratio was assumed stable moving forward (6-74) to estimate both overall population-specific probation recidivism to follow-up year 74.
Mobility
Our estimates do not include adjustments for interstate mobility. This is unlikely to have a large effect on current populations, but could influence the post-sentence population. There are two key issues in this regard: (1) interstate migration; and (2) whether people are disenfranchised in their current state if convicted elsewhere. In previous work modeling interstate mobility (Shannon et al. 2017), we found that adjustments for interstate movement play a relatively small role in estimating state post-sentence populations. This model applied mobility data from the general population to the formerly-convicted population, but little is known about how mobility patterns of this population might differ from the population as a whole. Several Urban Institute reentry studies suggest that at least 95% of the former prison population remains in the same state postrelease (LaVigne and Kachnowski 2003; LaVigne and Mamalian 2003; LaVigne and Thomson 2003; Watson et al. 2004). Overall, more people are moving to growing Southern states with stricter post-sentence disenfranchisement regimes than are leaving such states.
Mortality
For the death rate in the early life table years we also used BJS’s Recidivism of Prisoners Released in 1983 (Beck and Shipley 1989) and noted a rate of death of .0086535 by the third year after release (159 out of 18,374). To compare, we used National Corrections Reporting Program (NCRP) data for state-specific age at release. Using the NCRP median age for each state (when available — when unavailable used national median age) in each year, we used the Statistical Abstract of the United States to find the expected number of deaths for black males of the appropriate age (the highest death rate available among all reported groups). We find a slight difference between these two rates (with the released prisoner death rate highest), so in order to adjust our rates, we continue to use NCRP data for median age at release, and the Statistical Abstract’s expected rate of death, but we multiply these values by a constant (approximately 1.46 — multiplying the Statistical Abstract numbers from 1983 by 1.46 increases our death rate to that reported by the BJS). NCRP data are not available prior to 1983, so death rate for previous years was similarly obtained from the Abstract, but we used the average median age at release in the last three years we had data (1983-1985).
The all-cause population death rates for AA males (applied to all populations except for the sex-specific sub populations) were obtained from the CDC Wonder data tool for years 2018 onwards. Specifically, our estimates use the Underlying Cause of Death, 1990-2022 data series (for each respective year) using single-year ages for the Black or African American males for ages 25+. The crude death proportion for each age is calculated simply as death divided by population, which results in the proportion of AA males in a given year and age group to have succumbed to mortality. We carry forward the inmate adjustment as described above. We assume stability in death rates from 2022, to avoid “carrying forward” any post-covid mortality improvements from 2021-2022 into years where we expect the mortality improvements to have tapered off. NCRP data is used to key each death rate to the median age of release. Because publicly available NCRP data only includes a categorical age variable, a sampling technique is used to (a) stratify the data by release year, state, age of release, (b) sample for each case an age within the range of ages captured by the category of the case, (c) assign that case the sampled continuous age, and (d) calculate the median age of release on the sampled variable. This process assumes that the ages within each age bucket follow a uniform probability distribution within each response category.
Both the overall estimates and the African American and the Latino estimates use the death rate for AA males, adjusted for inmate mortality, as described above for the reasons of (a) parsimony with previous estimates, and (b) to make a conservative assumption of estimated mortality for the overall and Latino tables. However, due to the large extant sex-gaps in mortality, we use sex-specific mortality rates in the sex-specific estimates. We used CDC’s Wonder database for African American Male and Female death rates from 1999-2022. We supplemented historical sex-specific death rates from the Statistical Abstract of the United States. Death rates are entered into the sex-specific life tables keyed to the median age of release as estimated from the National Corrections Reporting Program (NCRP) data from 2017-2020, and stability is assumed from 2020 for the years 2021-2022. Death rates for both males and females are keyed to the NCRP median age of release as used historically in the overall life tables from 1948-2024. Each death rate was adjusted by the “prison” correction from the overall life tables (1.46).
Adjustment Factors
Double-Counting
Our focal input data to our post-sentence life tables are released from prison (both conditional and unconditional) and entries to felony probation. Therefore, there is a possibility that individuals released from prison are double-counted in parole populations and that our “post-sentence” felony probationers may be double-counted in current felony probation and jail counts. Therefore, we subtract the current parole, felony probation, and jail counts from our post-sentence estimate to avoid potential double counting. We subtract commensurate with each state’s disenfranchisement law (e.g., Delaware only has parolees subtracted due to its restriction of post-sentence disenfranchisement to a restrictive list of severe offenses such as homicide).
Clemency and Restoration of Civil Rights
For each of our post-sentence states, we subtract out the known clemencies and pardons reported to us by the appropriate state agencies. In our 2024 report, Alabama reported completing 8,296 investigations for voting rights and pardons in 2022 and 2023; the Arizona Board of Executive Clemency reported 2 pardons granted for 2022-2024, but this number does not include any rights restoration in county courts; the Delaware Board of Pardons reported granting 952 pardons and commutations for 2022-2024; Florida did not respond to our 2024 requests but in fiscal years 2021-2023 the Florida Commission on Offender Review reported 15,116 clemency cases completed. Iowa has automatically restored voting rights post-sentence for non-homicide convictions since Executive Order 7 was signed in 2020, but reported 6 pardons in 2022-2023; Kentucky reported 189,612 were awarded their voting rights, either through pardon or other restoration means from 2020-2024; Mississippi reported 79 restorations from 2022-2024; Virginia reported 6,540 restorations from 2022-2024; Wyoming reported 8 pardons and 3 restorations from 2022-2024. To estimate the number of subpopulation specific clemencies (e.g., number of female restorations), we adjust the overall number of clemencies by the ratio of pre-clemency subpopulation post-sentence population to the pre-clemency number of overall post-sentence population. In Alabama and Mississippi, we only deduct the proportion of total clemencies applicable to disenfranchising offenses, commensurate with the state-specific adjustments described below.
State-Specific Assumptions
Alabama
Alabama has a defined list of felony-level offenses that are disenfranchising, which they characterize as “crimes of moral turpitude” (identified here). We were not able to obtain complete historical conviction data for Alabama to precisely estimate the proportion of those with felony convictions who are disenfranchised. We did, however, obtain data on those currently in custody of the Alabama Department of Corrections (ADOC; as of August 23, 2024), including their current offenses and offenses for which they were previously incarcerated. We estimated the proportion of those who were disenfranchised in ADOC custody by identifying each person within the dataset who had at least one disenfranchising offense (0.75), and then applied that proportion to our counts. This approach assumes that convictions for crimes of moral turpitude (e.g., Burglary I and Burglary II but not Burglary III) would be sentenced to prison. To calculate the adjustment factor, we estimated the proportion of current ADOC population in custody who had been convicted of a disenfranchising offense (.75) and the proportion of Black people in ADOC custody convicted of a disenfranchising offense (.82). Note that Alabama estimates in Tables 2-6 do not represent those who are disenfranchised because of their present correctional status; rather, these estimates represent the present correctional status of those who are disenfranchised due to a conviction for a disqualifying offense in Alabama.
Arizona
Arizona’s post-sentence disenfranchisement only applies to those who are convicted of a second felony. We were not able to obtain robust current historical criminal conviction history data from Arizona to estimate adjustment factors for the post-sentence population. We adjust our post-sentence populations in the life tables and assume that 50% of prison releases and 26% of probation entries meet this criterion, as BJS documentation suggests 26% of total probation and jail inmates and 50% of prison and parole releases had a prior felony conviction (Langan and Cunniff 1992). This is commensurate with previous Locked Out reports.
Delaware
Delaware has an ineligibility list regarding certain felonies (murder, manslaughter, bribery/public corruption/sex offenses) which we estimate represents .094 of post-sentence individuals eligible for this list, based on the estimated national proportion of these offenses among people released from prison. As mentioned above, we only subtract current parole populations as the individuals eligible for this list will only be potentially double counted in the parole (rather than probation) population.
Florida
Our estimates for Florida assume that 67% of the total Florida post-sentence population has outstanding legal financial obligations or other restrictions that would disqualify them from restoration of civil rights under current Florida law and administrative practices (see Florida Commission on Offender Review, Rules of Executive Clemency 2022). This is the figure we had calculated for our 2022 report and it matches information received from the Florida Rights Restoration Coalition felony conviction database (personal communication with Al Barrentine, FRRC Director of Technology and Data Science, July 26, 2024). We apply this adjustment to both the post-sentence life table output and the double counting chunks subtracted. In Florida, some can avoid a formal felony conviction by successfully completing a period of probation. According to the Florida Department of Law Enforcement, as much as 40% of the total probation population holds this “adjudication withheld” status. According to reports by the Bureau of Justice Statistics, only about 50% of Florida probationers successfully complete probation. In light of this, we reduce the annual current disenfranchised felony probation numbers by 40% and individuals disenfranchised post-sentence by 20% (.4*.5=.20).
Iowa
Iowa has automatically restored voting rights post-sentence for non-homicide convictions since Executive Order 7 was signed in 2020. Post-sentence disenfranchisement had been reinstated in 2011 and therefore our life table counts only cohorts from 2011 prison releases and probation entries onwards. Today, Iowa restricts the right to vote only to those qualifying under statute 7.07 (felony murder) and therefore we adjust prison and felony probation life table output by .013 and subtract parole to avoid double counting. We estimate the proportion of people post-sentence that are chapter 707 cases (and thus disenfranchised) based on prison release patterns from 07/01/2014-08/08/24 (see, e.g., https://data.iowa.gov/Correctional-System/Offenders-Released-from-Iowa-Prisons/runv-jsix/about_data).
Kentucky
Kentucky disenfranchises post-sentence individuals only if they match an eligibility list (treason, bribery in an election, criminal or fetal homicide, second-degree assault or assault under extreme emotional disturbance, first-degree strangulation, human trafficking, or violence). We assume 55% of prison releases and 20% of felony probation entries for cohorts since 2020 match the above list, after a 2019 executive order reenfranchised all those not eligible for the list via clemency. Therefore, we only subtract a portion of each current population (.39 for parole, .2 for felony probation and jail) to avoid double counting.
Louisiana
In Louisiana, people currently serving probation sentences and parole sentences who have not been incarcerated in prison during the previous 5 years are eligible to vote. We lack detailed data on the number of people within the 5-year window, but it includes the clear majority of people on parole in Louisiana and relatively few people on probation. Our estimates assume that 90% of people currently on parole and 10% of people currently serving felony-level probation sentences have been incarcerated in prison within the previous five years or convicted of a disqualifying offense, and are therefore disenfranchised.
Mississippi
Mississippi disenfranchises people convicted of 22 general crimes for life unless they are restored through an act of the state legislature. Although many of these general crimes do not directly map on to existing statutes, the Mississippi Administrative Office of Courts (AOC) maintains a list of disenfranchising offenses that fit within the scope of the 22 general crimes based on the interpretations of the Mississippi Constitution by the Mississippi Attorney General’s Office or the courts (found here). We obtained criminal court conviction data for cases with dispositions from 1995 through 2018 (we also obtained data for 2019 through 2023, but the MS AOC would not provide date of birth information). We used the Python package Dedupe (Gregg and Eder 2022) to create person level identifiers, and then estimated the proportion of those who had been convicted of a disenfranchising offense within the available period of the data (1994-2018) (.28). Given that this period is missing individuals who were missing from the Mississippi data in the earlier years (pre-1994) and have longer exposure times to garner a disenfranchising offense, we adjust this proportion upwards by the ratio of missing cohort counts to observed across our study period, resulting in a final overall adjustment factor of .31. The Mississippi data also display stark racial disparities in the proportion of disenfranchising offenses between Black and non-Black defendants (specifically, 1.8 times on average across the series), making a stability assumption for the adjustment factor between our overall and Black estimates untenable. To avoid undercounting the number of disenfranchised Black Mississippians, we therefore calculate a Black-specific adjustment factor that accounts for this disparity via solving the following weighted average formula: .31 (overall adjustment) = 14+(1.8*x*(unadjusted Black post-sentence pop/unadjusted non-Black post-sentence pop)))/2. This solves for the non-white adjustment factor, while keeping the combined overall adjustment constant and weighting each adjustment by the ratio of non-Black and Black pre-adjusted post-sentence estimates. We then obtain the Black adjustment factor by taking the non-Black adjustment factor .22, and multiplying by the observed Black to non-Black ratio 1.8 for a final Black adjustment factor of .40. We applied this proportion to our counts under the assumption that the general ratio of disenfranchising to non-disenfranchising offenses is relatively stable over time. Mississippi estimates in Tables 2-6 thus represent the present correctional status of those who are disenfranchised because of a conviction for a disqualifying Mississippi offense rather than those who are disenfranchised based on their present correctional status.
Tennessee
In Tennessee, we count all pre-1973 individuals (conditional on offense), and all individuals in years 1981 and after, as Tennessee citizens were not disenfranchised from 1973-1981 and the 1981 restrictions were not retroactively applied to release cohorts within this window. Tennessee also has an eligibility list that prevents some post-sentence individuals from applying for voting restoration, and therefore we subtract out the successful applications via our clemency numbers (pardons and reported successful applications since 2018 according to the TN Secretary of State). Although Tennessee has a number of mechanisms to restore voting rights, relatively few are successful in attaining restoration. The Tennessee Secretary of State’s office reported that only 3,350 Tennesseans regained their voting rights from 2018-2023 (McGee 2023).
Wyoming
Wyoming restores voting rights after a five-year waiting period to people who complete sentences for first-time, non-violent felony convictions. Therefore, we adjust our life tables by the following factors: prison (assuming .55 non-first-time, .50 violent); felony probation (.26 non-first-time, .2 violent).
Consistency with Past Estimates
Based on our legal review and consultation with experts in Alabama and Mississippi, we updated our 2024 methodology to include more refined estimates of the ineligible populations in these states. This means that our estimates now exclude people convicted of felonies that do not specifically appear on the state lists of disenfranchising offenses (described in the section on State-Specific Assumptions). We also adjusted our earlier published estimates for 2000, 2004, 2010, 2016, and 2022, removing those convicted of non-disenfranchising offenses in Alabama and Mississippi for these years. This resulted in a sizeable reduction in our estimates in these states, particularly in Mississippi. As shown in the table below, this also reduces our published national estimates. In 2022, for example, this reduces our published national total estimate from 4,644,708 to 4,399,983. Such estimates are also subject to error, of course, and we currently lack the data required to apply such adjustments prior to 2000. The published and adjusted estimates are equivalent for 2024.
| US Published | US Adjusted | AL Published | AL Adjusted | MS Published | MS Adjusted | |
|---|---|---|---|---|---|---|
| 2024 | 4,049,978 | 4,049,978 | 227,437 | 227,437 | 68,731 | 68,731 |
| 2022 | 4,644,708 | 4,399,983 | 318,681 | 239,010 | 239,209 | 74,155 |
| 2020 | 5,177,780 | 4,933,476 | 328,198 | 246,149 | 235,152 | 72,897 |
| 2016 | 6,106,327 | 5,884,215 | 286,266 | 214,699 | 218,181 | 67,636 |
| 2010 | 5,852,180 | 5,650,505 | 272,354 | 196,766 | 182,814 | 56,728 |
| 2004 | 5,259,530 | 5,096,172 | 250,046 | 187,535 | 146,155 | 45,308 |
| 2000 | 4,686,539 | 4,550,616 | 212,650 | 159,488 | 119,943 | 37,182 |
Voting Eligible Populations (VEPS)
The denominators for our disenfranchisement rates are sourced from the American Community Survey’s five-year estimates from 2018-2022. Specifically, we access the Census Bureau’s API via the ‘tidycensus’ package in R (Walker, Herman, Eberwein, and Walker 2024), and calculate the number of overall, Black, Latino, Male and Female voting eligible citizens in each state using the “B05003” set of columns and summing the estimated native-born and naturalized U.S. citizens of age 18 or over for each population.
| 1. | For earlier reports, see Uggen, Larson, Shannon, and Stewart 2022; Uggen, Larson, Shannon, and Pulido-Nava 2020; Uggen, Larson, and Shannon 2016; Uggen, Shannon, and Manza 2012; Manza and Uggen 2006; Uggen and Manza 2002. |
|---|---|
| 2. | These figures differ slightly from those in previous Locked Out reports due to changes in estimation methodology in Alabama and Mississippi, as detailed in the “Consistency with Past Estimates” section in the Appendix. |
| 3. | Our estimate for the total disenfranchised population exceeds our combined male and female estimates by less than 3 percent, due in part to missing or unreported data on sex, impacted individuals who do not identify as male or female, and slight differences in the combined versus sex-specific estimation strategies. |
| 4. | The Voting Eligible Population is distinct from the Voting Age Population in that it excludes non-citizens. Our estimates for these populations are based on American Community Survey indicator B05003. |
| 5. | As noted in the footnotes to Table 1, Nebraska enacted legislation to restore voting rights upon the completion of sentence in 2024, eliminating that state’s 2-year waiting period. The law’s status is in question and the Nebraska Supreme Court heard oral arguments on August 28, 2024. As of this writing, the Court had not yet issued an opinion. |
| 6. | As noted in Table 1, the expansion of voting rights in North Carolina was short-lived. In April 2023, the North Carolina Supreme Court overturned a 2021 state court’s decision to restore voting rights to people on community supervision in that state. |
| 7. | Alabama has a defined list of felony-level offenses that are disenfranchising, which they characterize as “crimes of moral turpitude.” As described in the appendix, we obtained data on those currently in custody of the Alabama Department of Corrections in August 2024, which includes both current offenses and offenses for which they were previously incarcerated. Based on these data, we estimate the proportion of those who were disenfranchised in custody by identifying each person within the dataset who had at least one disenfranchising offense (0.75), and then applied that proportion to our counts. Mississippi disenfranchises people convicted of 22 general crimes. We obtained criminal court conviction data for cases with dispositions from 1995 through 2018. We used the Python package Dedupe (Gregg & Eder 2022) to create person level identifiers, and then estimated the proportion of those who had been convicted of a disenfranchising offense within that period (0.35). We applied this proportion to our counts under the assumption that the general ratio of disenfranchising to non-disenfranchising offenses is relatively stable over time. |
| 8. | Our statistics for Florida assume that 67% of the total Florida post-sentence population has outstanding legal financial obligations or other restrictions that would disqualify them from restoration of civil rights under current Florida law and administrative practices (see Florida Commission on Offender Review, Rules of Executive Clemency 2022). This is the figure our team had calculated for our 2022 report, and it matches information received from the Florida Rights Restoration Coalition felony conviction database (personal communication with Al Barrentine, FRRC Director of Technology and Data Science, July 26, 2024). |
| 9. | Alabama reported completing 8,296 investigations for voting rights and pardons in 2022 and 2023; the Arizona Board of Executive Clemency reported 2 pardons granted for 2022-2024, but this number does not include any rights restoration in county courts; the Delaware Board of Pardons reported granting 952 pardons and commutations for 2022-2024; Florida did not respond to our 2024 requests but in fiscal years 2021-2023 the Florida Commission on Offender Review reported 15,116 clemency cases completed. Iowa has automatically restored voting rights post-sentence for non-homicide convictions since Executive Order 7 was signed in 2020, but reported 6 pardons in 2022-2023; Kentucky reported 189,612 were awarded voting rights, either through pardon or other restoration means from 2020-2024; Mississippi reported 79 restorations from 2022-2024; Virginia reported 6,540 restorations from 2022-2024; Wyoming reported 8 pardons and 3 restorations from 2022-2024. |
| 10. | Arkansas requires payment of court costs, fines, supervision fees, and restitution; South Dakota requires payment of fines, fees, and restitution; and Texas requires payment of fines. Three states in addition to Florida condition eligibility for re-enfranchisement on payment of some or all legal financial obligations. Alabama conditions re-enfranchisement after a first felony on payment of fines, fees, court costs, and victim restitution; Arizona conditions restoration after a first felony on payment of restitution; and Tennessee conditions restoration on payment of restitution, court costs (unless a finding of indigency was made), and child support. Kentucky requires repayment of restitution to be eligible to apply for restoration of civil rights. Iowa conditions eligibility for re-enfranchisement for people convicted of homicide crimes before July 4, 2005 on repayment of court costs, restitution, and fines (or being current on a payment plan). Our King & Spalding legal research team also notes that monetary sanctions such as fines could potentially affect voting rights in several other states, including North Carolina, Oklahoma, South Carolina, West Virginia, and Wisconsin. |
| 11. | The Georgia Secretary of State’s language can be found at the asterisk on the My Voter Page: https://mvp.sos.ga.gov/s/voter-registration?IsRegisterNow=true. The Georgia Justice Project website reiterates that all fines are automatically canceled upon completion of probation and that individuals can still vote even if restitution or other fees are still owed. See https://gjp.org/voting/ |
| 12. | Some states have missing data for percent Hispanic. Alabama is missing the entire series of observed Hispanic prisoner counts, and we therefore assume that the estimated probation series is equal to that of Alabama’s probation series. For states with missing data within an observed series, linear interpolation was performed using observed data from the surrounding observed years in each state-specific series. For states with % Hispanic |
| 13. | For the years 1948-1967 Hispanic ethnicity data is not available in the CPS. Therefore, stability is assumed from the estimated 1968 value going backwards in time to 1948 for each state. |
| 14. | x*(unadjusted non-Black post-sentence pop/unadjusted Black post-sentence pop |


